- Author
Casper van Elteren
Quickstart
Setting up the model
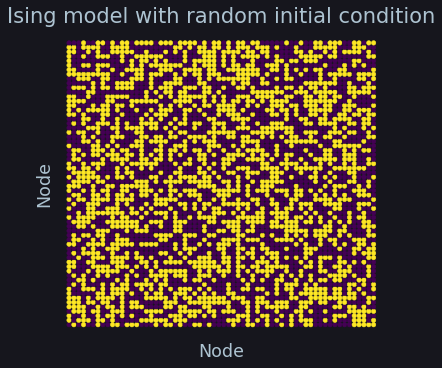
Plexsim relies on networkx to create a graphical structure on which to
simulate models. Various models are available in plexsim.models. Below the
Ising model is used
from matplotlib import style

style.use("seaborn-poster".split())
import numpy as np, os, sys, networkx as nx, warnings, matplotlib.pyplot as plt

warnings.simplefilter("ignore")
from plexsim import models

# init lattice graph with periodic bounds
g = nx.grid_graph((64, 64), periodic=1)
# create an ising model
temperature = 2.5

# async with sampleSize > 1, can be seen as sampleSize of glauberupdates in 1 simulation step
settings = dict(
    graph=g,  # graph for the model
    t=temperature,  # temperature for the Ising model
    sampleSize=len(g),  # how many nodes to update per simulation step (default)
    updateType="async",  # the update buffers are not independent, use sync for dependency(default)
)
m = models.Ising(**settings)
# create coords an visualize grid with periodic bounds
# leverage the fact that grid returns tuples of coordinates
pos = {i: np.array(eval(i)) for i in m.graph.nodes()}
# create color map for the possible states of the model
colors = plt.cm.viridis(np.linspace(0, 1, m.nStates))
fig, ax = plt.subplots(constrained_layout=1, figsize=(5, 5))
nx.draw(m.graph, pos=pos, ax=ax, node_color=colors[m.states.astype(int)], node_size=20)

C = "#ADC3D1"
fc = "#16161D"
ax.margins(0.05)
ax.set_title("Ising model with random initial condition", fontsize=21, color=C)
# ax.axis('equal')
ax.set_ylabel("Node", labelpad=1, color=C)
ax.set_xlabel("Node", color=C)
for i in "left right bottom top".split():
    ax.spines[i].set_visible(False)
ax.axis(True)
ax.set_xticks([])
ax.set_yticks([])
ax.set_facecolor(fc)
fig.set_facecolor(fc)
fig.show()
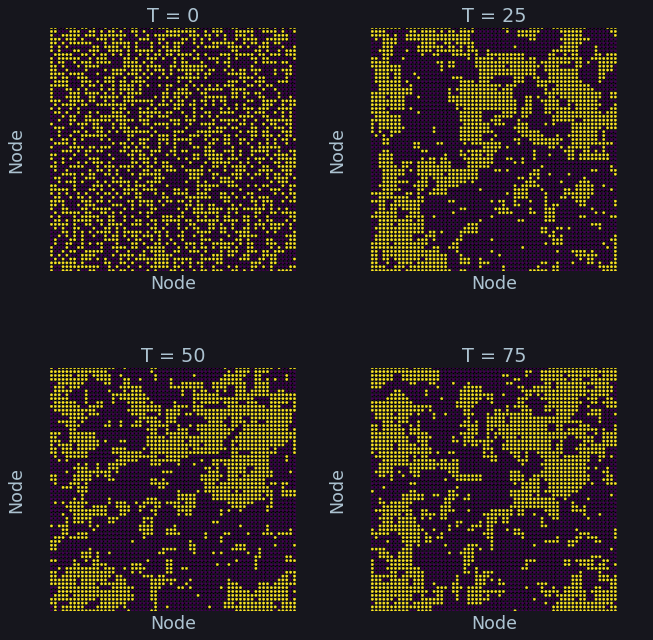
Simulation
n = int(1e2) # simulation steps
m.reset() # reset model to random condition
sim_results = m.simulate(n)
# show averages
spacing = np.linspace(0, n, 4, endpoint = False).astype(int)
fig, ax = plt.subplots(2, 2, figsize = (10,10), constrained_layout = 1)
for idx, axi in zip(spacing, ax.flat):
    tmp = sim_results[idx]
    nx.draw(m.graph, pos = pos, ax = axi, node_color = colors[tmp.astype(int)],
            node_size = 5)
    axi.axis('equal'); axi.axis(True); axi.grid(False)
    axi.margins(0)
    axi.set_title(f'T = {idx}', color = C)

    axi.set_facecolor(fc)
    axi.set_ylabel("Node",  labelpad = -5, color = C)
    axi.set_xlabel("Node", color = C)

    for i in "left right bottom top".split():
        axi.spines[i].set_visible(False)

fig.subplots_adjust(wspace = .05, hspace = .4)
fig.set_facecolor(fc)
fig.show()
Other parameters
The documentation is a work in progress. Please check out the source code for different models.