Air Quality Monitor

Table of Contents
During the COVID pandemic all of us had to work from home. The rapid change from work being at the office now being completely at home came with many challenges such as work-life balance, good ergonomics and ensuring enough exercise to keep your body (and mind) healthy. One thing that gets less attention is the quality of the air your breath. It is well known that increased levels of C02 can reduce cognitive functioning. Increase in fine and coarse dust particles can lead to pulmonary issues and so on. For some time I wanted to get some grip on my local air quality but wasn’t really happy with the options out there for several reasons. First, many sensors do not offer measuring different measures together, for example some sensors may measure temperature and humidity, but not fine dust particles or C02 (or take any combination of the 3). Second, I want to be in control of my own data; I don’t want an attached online service be it free or not, I want to own and export the data. Third, the air quality monitor needs to connect over WiFi for easy interfacing.
Few weeks ago my interest sparked again after looking at some air filters that IKEA offers and I started exploring the world of air quality monitors. I ended on a DIY solution from a company called AirGradient. They offer a DIY solution that measures C02, temperature, humidity, fine and coarse dust particles. I decided to place an order for PCBs and sourced the parts (they also offer ready made units or kits).
The following will describe the build, WiFi connection and hooking it up to prometheus on my server to probe and store the data (similar to Jeff Geerling’s write-up).
Dealing with the different components in this setup was a bit overwhelming; it required combining different (very) mature programs. Although I am not the first to trot in the river of home monitoring, I hope this helps some future person (or me) navigate the space a bit better. It is by no means a complete guide. I will be setting this system up with my shiny new server running TrueNAS Scale (more on that at a different time).
The setup
The system consists of three components (12):
- Airquality metrics are collected by the airgradient unit
- C02
- Temperature & humidity
- PM02 and PM10 (dust particulates)
- The data is read from the airquality monitor and pushed to a data logger (prometheus)
- The data is visualized as a dashboard (grafana)

Sensor data probing
Airgradient provides a github repo with code for reporting on the various air quality metrics. By default it can push to an external dashboard hosted by airgradient. However, since I want to self-host, we have to edit the code a bit. In order to expose the sensor data, we have to do two things:
- Setup a server
- Write handlers for:
- Payload
- Not handles requests
To setup the server, we have to download and include the ESP8266 web server to serve the sensor data. Next, we advertise the data as a json file. The following edits are added to the code to achieve this.
    //...
    #include <ESP8266WebServer.h>
    // setup server
    const int port = 80;
    ESP8266WebServer server(port);

    String createPayload(){
      // ignore data if it possess negative values
      return "{\"wifi\":" + String(WiFi.RSSI())
          + (Co2 < 0 ? "" : ", \"rco2\":" + String(Co2))
          + (pm25 < 0 ? "" : ", \"pm02\":" + String(pm25))
          + (TVOC < 0 ? "" : ", \"tvoc_index\":" + String(TVOC))
          + (NOX < 0 ? "" : ", \"nox_index\":" + String(NOX))
          + ", \"atmp\":" + String(temp)
          + (hum < 0 ? "" : ", \"rhum\":" + String(hum))
          + "}";
    }

    void sendPayload(){
      String payload = createPayload();
      server.send(200, "application/json", payload);
    };

    void handleNotFound(){
      server.send(404, "text/plain", "Not Found");
    };


    // setup server
    void setup(){
      // ... other stuff
      // setup server
      server.on("/metrics", sendPayload);
      server.onNotFound(handleNotFound);
      server.begin();
    }

    // edit loop to process events
    void loop {
        // ...
        server.handleClient(); // process on events
    }
Prometheus
For prometheus the airgradient unit has to expose a `/metrics` url. I modified the airgradient code to expose the sensor values which can then be read by prometheus. Getting prometheus installed was easily done through the TrueNAS interface, however, it was completely unclear how to load the metrics into the interface. When prometheus is booted up, you are greeted with a rather blank looking interface. There is a command-like prompt that you can probe. I assumed initially that the interface would allow me to point to a particular url to fetch the data. This wasn’t the case (or at least I was not able to figure it out).
With TrueNAS, you can smoothly install apps and quickly toggle some settings to configure a package. However, when things become more involved, I find the system a bit limiting. For example, the tutorials on Prometheus requires one to edit a config json file to setup where it can fetch data from. Inside the TrueNAS interface there is no such config option (e.g. a file path you can give or something along that order). I was therefore rather confused as to where I should edit these changes. For the time being I ran
find / -name "prometheus.yml"
(which for me was under `/mnt/ssd-storage/ix-applications/releases/prometheus/volumes/ixvolumes/config/prometheus.yml`)
Inside a terminal and edited the file on my app-pool inside TrueNAS. The config file looks as follows:
    crape_configs:
      - job_name: 'airq-monitor'
        metrics_path: /metrics
        scrape_interval: 30s
        static_configs:
          - targets: ['192.168.1.134:8080']
Reloading prometheus then allowed me to probe for different variables exposed from the sensor.
Grafana
At the time of writing, Grafana is offered on TrueNAS truecharts inside the incubator channel. However, for the life of me I couldn’t get it to expose the web-api. According to the documentation, Grafana has gone through a change whereby it first offered as command line interface and server separate. The new image renderer packages the two combined to prevent issues that were ramping up with the old server. Long story short, in the end I used a local installation to connect to my server and set it up there yielding:
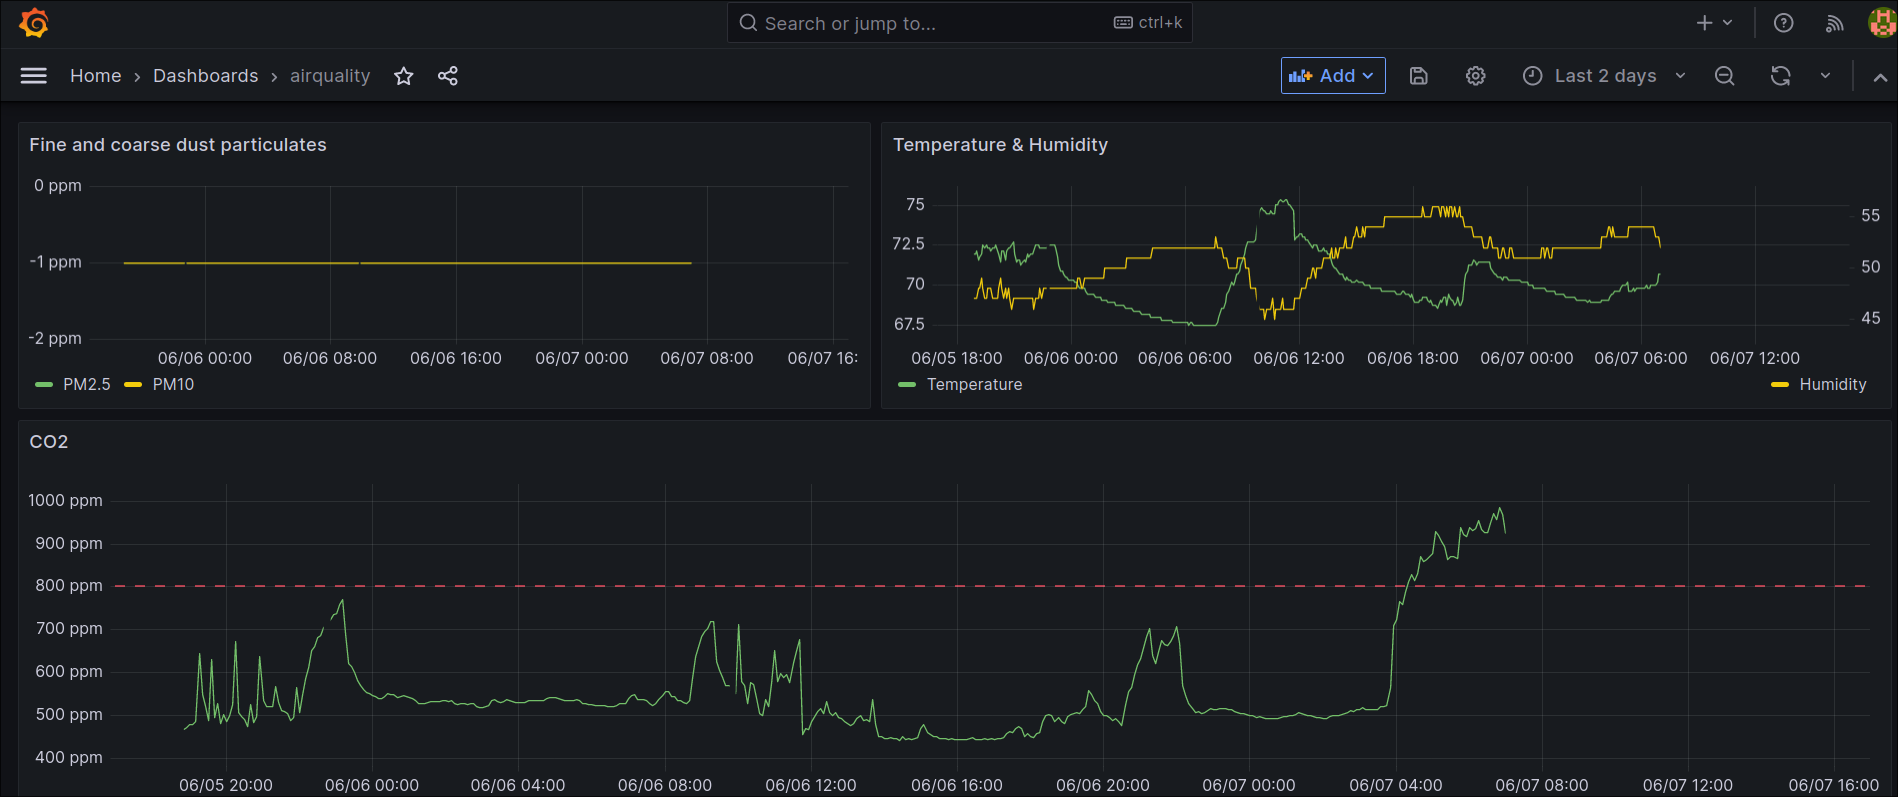
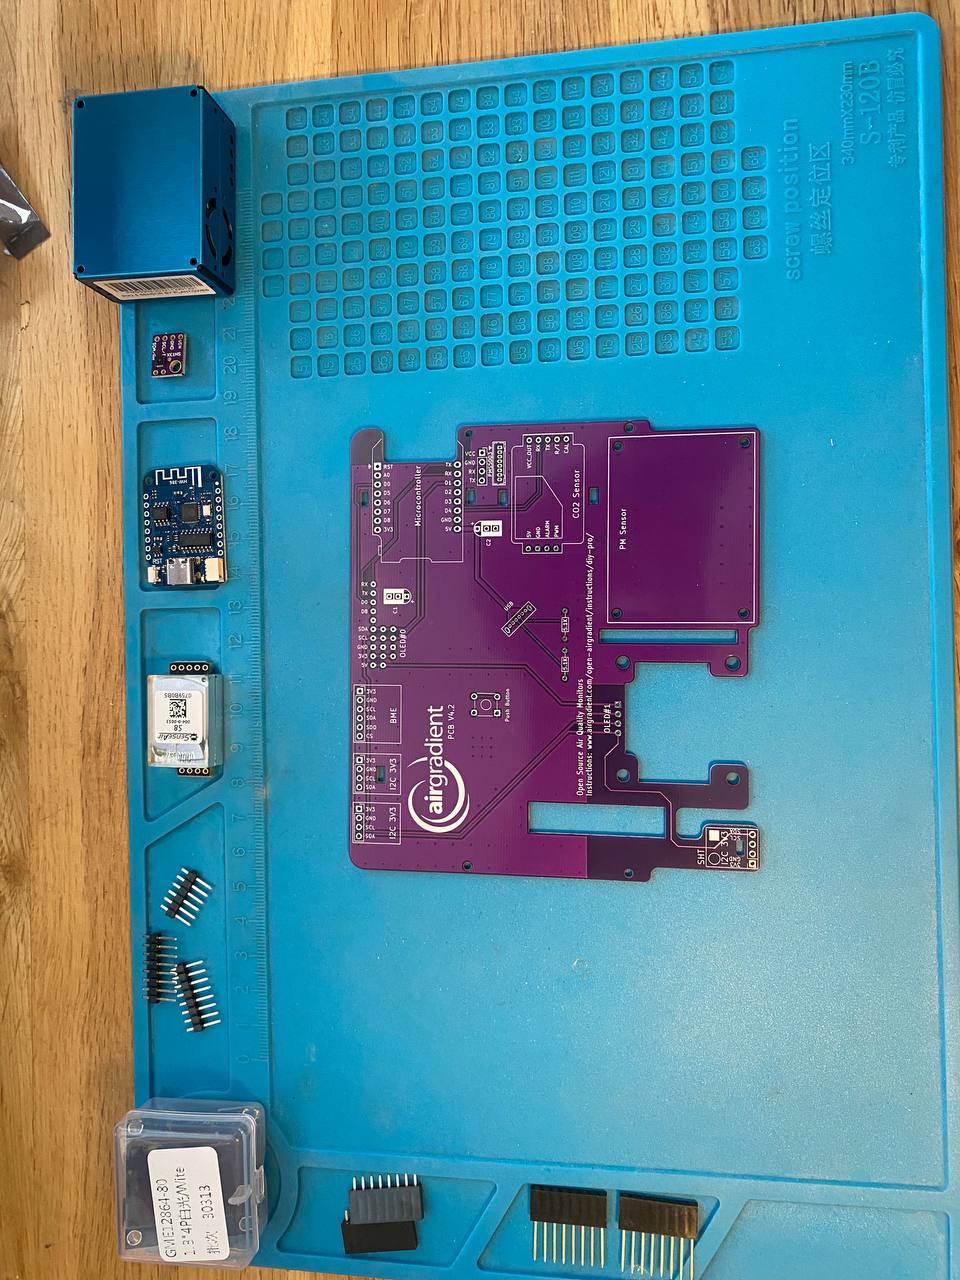
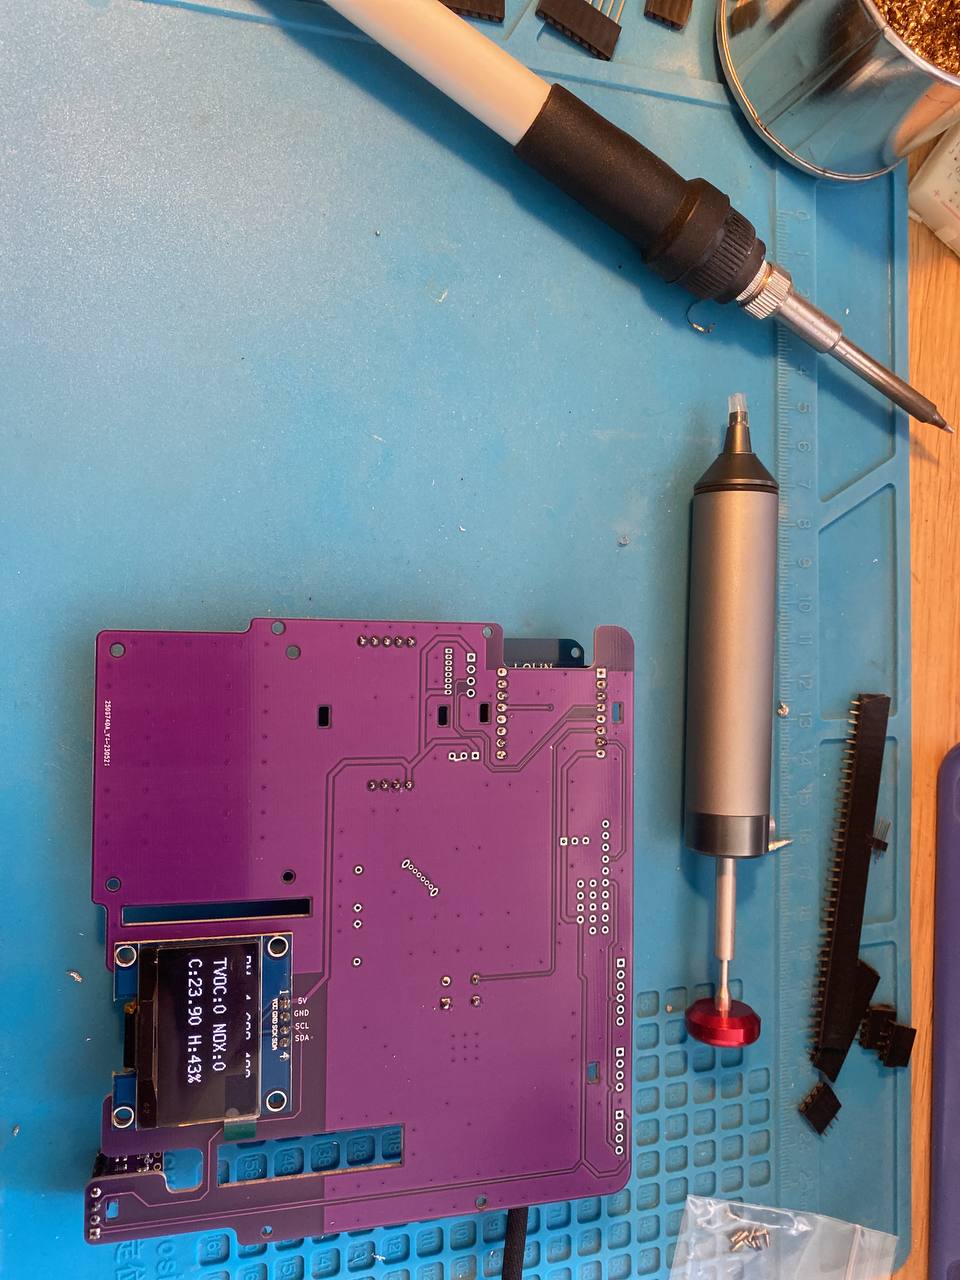
The build
I built the 4.2 version of the PCB and followed the instructions on the AirGradient website. The soldering involved is straight forward and can readily be achieved by a beginner (27, 28). Combined with the clear instructions and photos on their website, you can’t go wrong!
Casper van Elteren
Computational scientist | Data scientist | Tinkerer
I am a computational scientist interested in data analysis, visualization and software engineering.